Market Structure Over Numbers: Why Context Matters
A solitary price figure communicates zero information about whether an asset is recovering from a steep sell-off, consolidating in an accumulation range, or breaking out to new all-time highs.
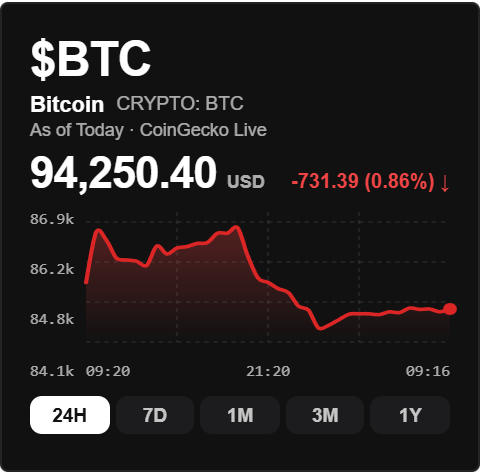
The Crypto Market Chart pairs live price telemetry with an interactive SVG area spline that reveals macro market structure across 24 hours, 7 days, 1 month, or a full year.
Scrub your cursor across the chart to inspect historical price points and timestamps, giving you instant market perspective without leaving your Notion research page.
Distraction-Free Charting: Clean Visuals Without Trading Clutter
Native trading platforms like TradingView are designed for technical day traders, loaded with complex indicators (RSI, MACD, Bollinger Bands) and popups that overwhelm general investors.
Our widget strips away the clutter, presenting a serene, high-contrast vector curve with subtle gradient shading that complements modern Notion dashboard aesthetics.
Embedded atop investment theses, venture pitch decks, or tokenomics databases, it provides elegant visual authority.
4 Market Research Frameworks for Notion
The Macro 1Y Trend Review
Switch to the 1-year view every month to evaluate whether macro cycle trends align with your long-term thesis.
The Tokenomics Research Deck
Anchor above your fundamental analysis notes to cross-reference market cap growth against protocol milestone deliveries.
The Intraday 1D Volatility Check
Inspect 24-hour range during high-volatility news events without opening loud trading apps.
The Obsidian Dark Terminal Aesthetic
Pair with dark Notion callout blocks for a high-tech financial research hub.
Architectural Breakdown: Interactive Market Chart vs. TradingView Iframes
Why clean vector market charts provide a better Notion workspace experience than heavy trading embeds:
Third-Party Apps & Tabs
Context switching, external logins, and notifications